In my last post, we examined the United States employment landscape in relation to candidate screening processes. The moral of the story: endless candidate screening processes cost a boatload of money, and single-handedly lower an organization’s chance to capture top talent.
To recap… the unemployment rate in the United States is 5.0%. The active employment participation rate in the US is 62.9% (meaning 124.73 million people in October 2016); and the number of people actively looking is approximately 112 million. That leaves at least 13 million of the US working population not looking for employment. The 105.8 million people who are actively looking, but not unemployed are not able or willing to go through a strenuous set of hoops for most jobs, while those who are casually looking absolutely will not.
Based off of this remaining applicant pool, let’s look at what these statistics mean to you when evaluating your apply process.
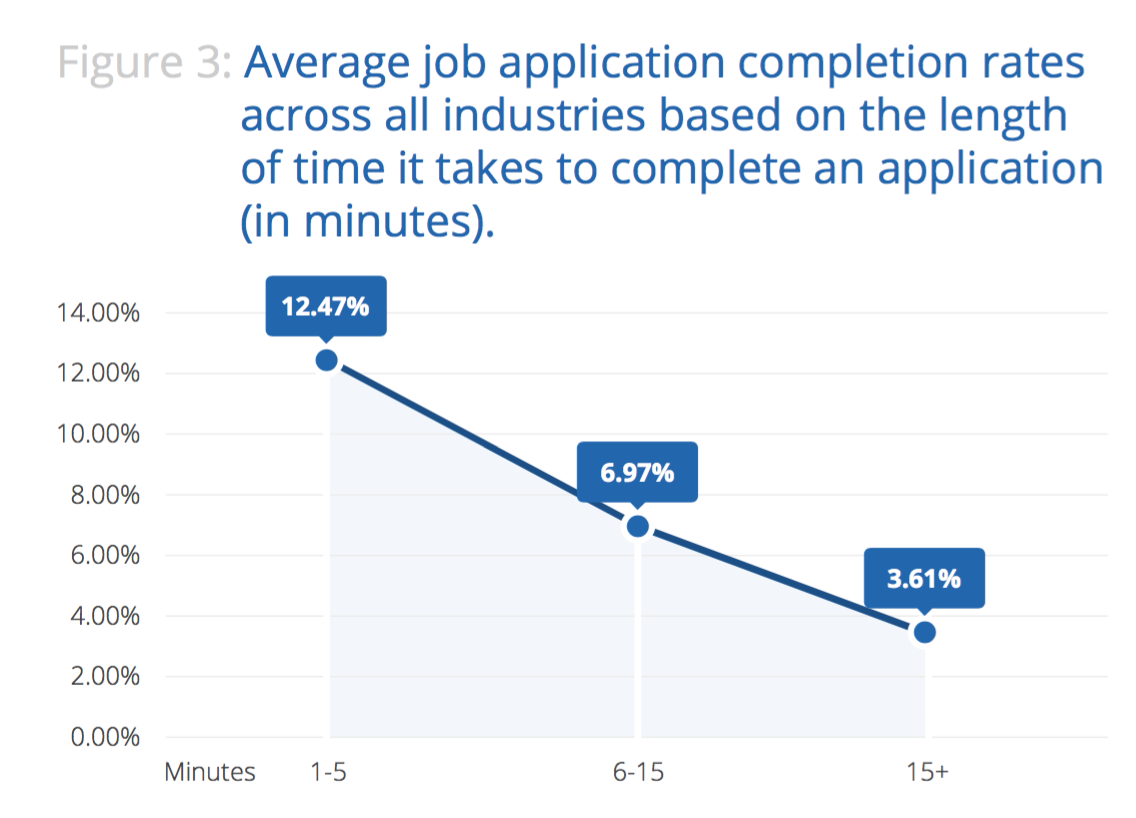
A ‘click to apply’ ratio measures the number of candidates viewing a job advertisement who go on to complete the application.

*Source: ‘How Job Descriptions, Titles, and the Apply Process Impacts Conversion Rates and Sourcing Costs.’
If your click to apply ratio is under ~12% – an industry benchmark – you are losing a lot more candidates during your application process than your competition. This means that not only are you ending up with a slate of sub-par candidates, but you are paying a lot more for them than you should. And if that isn’t bad enough, those great candidates are still winding up somewhere, and they are paying less for great quality, then you are for mediocrity.
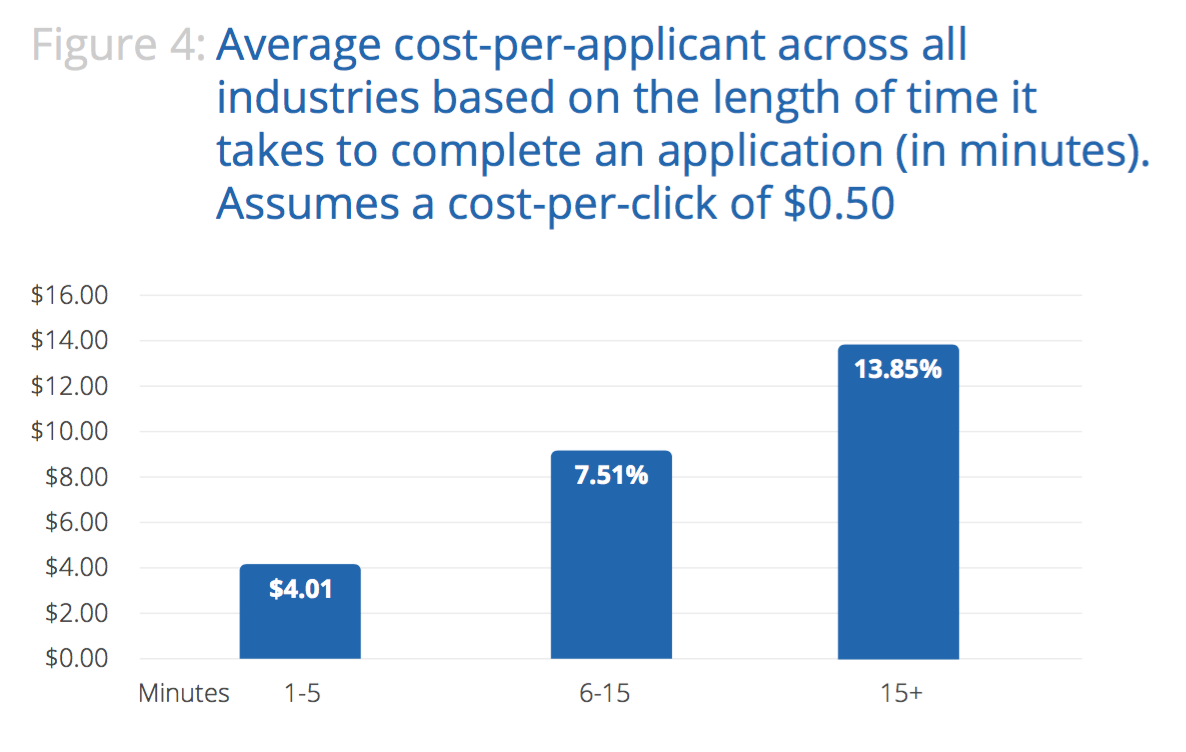
Let’s think about this through an easy example: you are spending $100 for 100 candidates to click through to your career site, but only 11 complete the apply process. If you need 22 candidates to apply to make a hiring decision, then you must spend $200. BUT, if your click to apply rate is lower than industry standard, like 3% for example, you need to spend approximately $760 to get the same number of candidates through your process. That’s almost 4x your media spend as compared to your competitors.
An ‘applicants to hire’ ratio is the number of completed applications you need to receive in order to make a hire. In this previous example, because your site is chasing away your best candidates, your applicants to hire ratio is going to be driven up. So, instead of 22, let’s say it now takes you 44 applicants to get a ‘quality’ hire. This brings your cost per hire (in recruitment media only), up to $1520. You’ve effectively significantly driven up your cost of hire… and that’s just for the advertising.

*Source: ‘How Job Descriptions, Titles, and the Apply Process Impacts Conversion Rates and Sourcing Costs.’
But wait, there’s more… now you are screening twice as many candidates too, effectively doubling the cost of assessing candidates in the amount of time spent evaluating them and the spend on any tools you might employ. This all assumes that you are able to find enough quality applicants that result in a hire. Oftentimes, the process does not necessarily result in a hire, which adds another layer of cost – outside recruitment.
This may have sounded like a long, dramatic, ‘sob story,’ but in reality, it’s not! Implementing small changes in your recruiting strategy can significantly improve the quality of applicants you are receiving, and for less spend. Appcast analyzed 400,000 job seekers looking at job advertisements on the web and the 30,000 applies that resulted from those searches to find the length of job descriptions, titles, and apply processes that deliver the best ROI. Download the full research report here and start making incremental changes today to see immediate impact on your candidate recruitment media costs.
This post was originally published in 2016, and has since been updated.


